Version 3.2 is available (and it is FREE for all our customers!)
We are happy to announce a major upgrade in both our R&D (Monitor) and Production (Qualitance) software, which is now available, for FREE, to all users with versions 2.x.
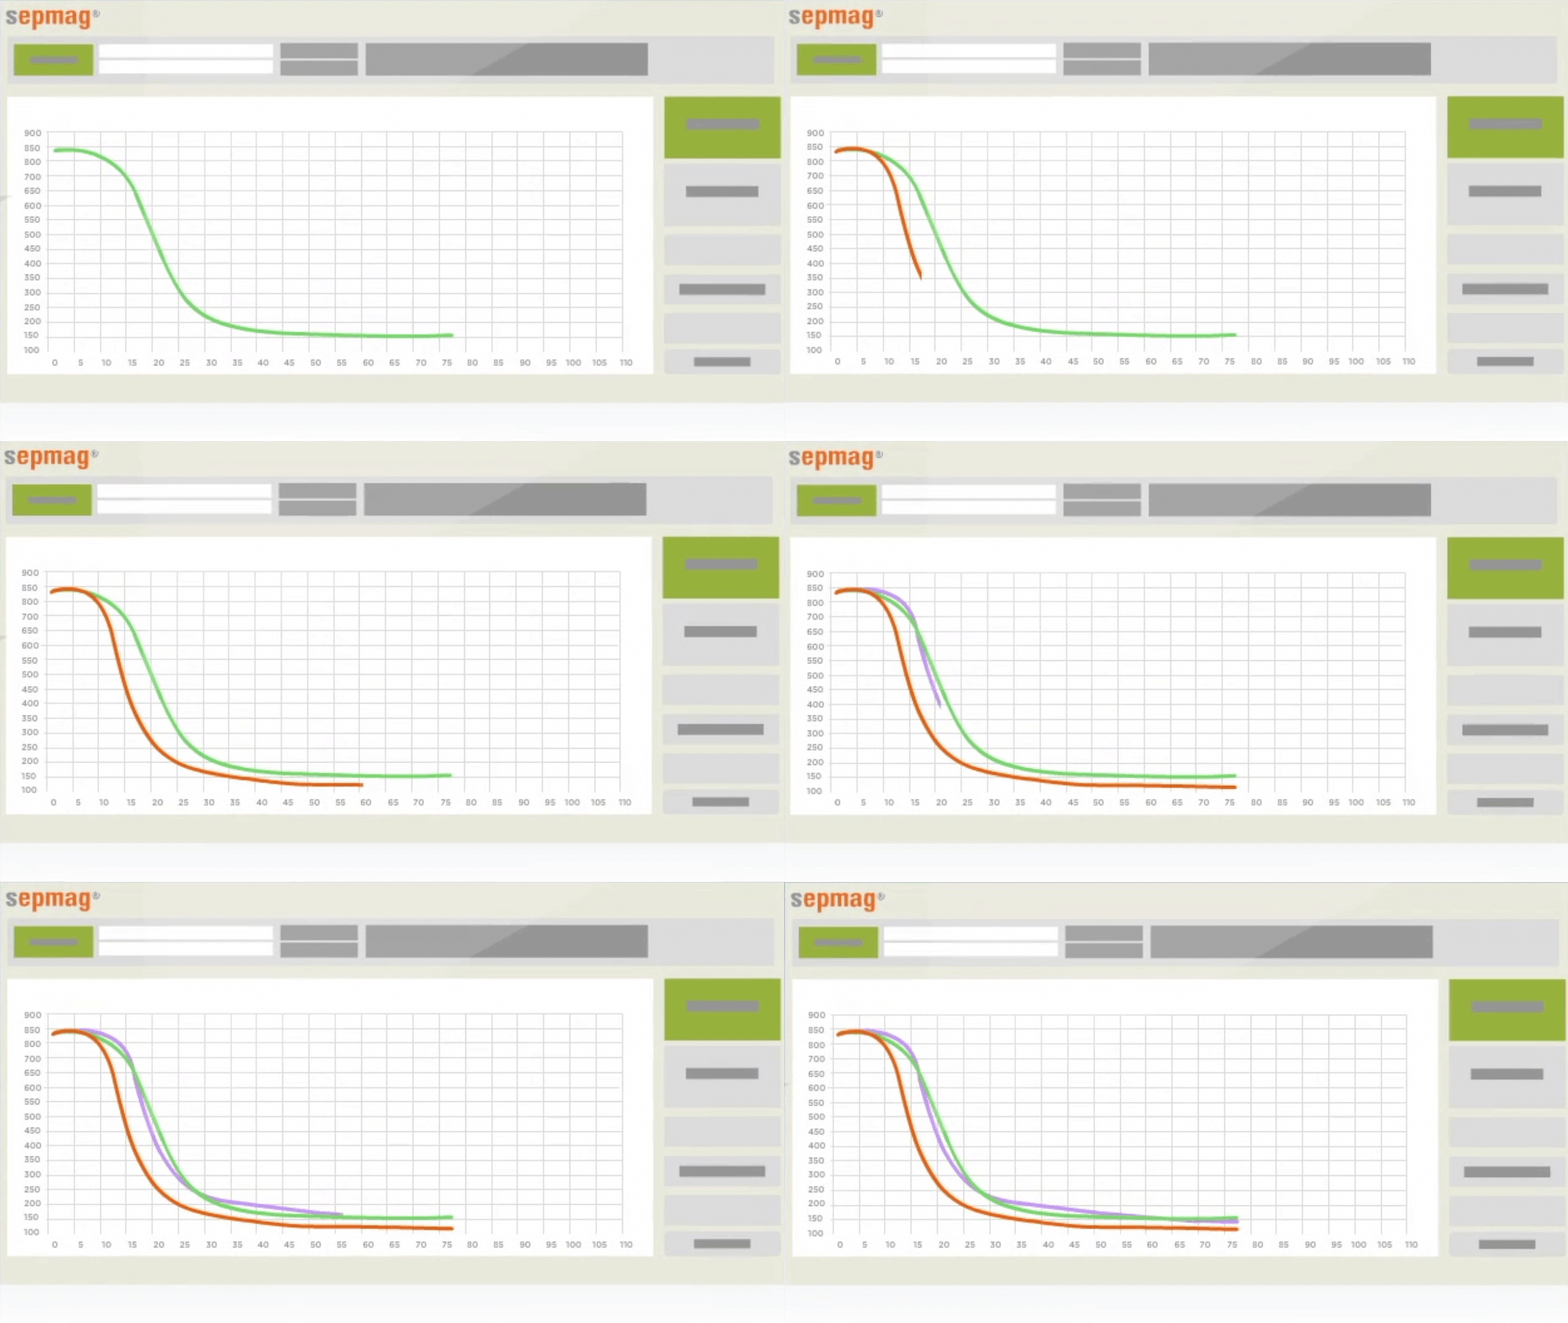
Our Development Team has been working on a new fitting algorithm, faster and more robust than the previous one, together with several additional functions that will help you get a more accurate fitting of your experimental data.
As the number of Sepmag users continues to increase, our Biomagnetic Separations systems have to deal with a larger variety of magnetic beads and particles, a wider range of concentrations, more buffer compositions, and a variety of vessels (including round bottom flasks!). Some users provide us with the feedback of a small fraction of samples for which, despite being separated without problems, the original algorithm gave strange fitting results. This was not a big surprise: because it was originally developed and tested only with IVD-manufacturing suspensions (a subset of all the possible magnetic beads and particle suspensions), the algorithm showed some difficulties to properly converge with some R&D samples and exotic buffers.
As soon as we detected these limitations, a team of scientists and programmers started to review and improve the fitting algorithm, testing it with a wider set of samples (including most of the ‘problematic’ ones). The result was a new algorithm, not only better but also faster, that we have included in version 3.2 of our software. The new algorithm also provides the determination coefficient r2 and gives out a warning if its value is lower than 0.99 (an indication of potential problems with the fitting).
During the development process, we realized that, besides the algorithm limitations, some of the experimental data convergence problems are caused by simple reasons: last/first points out of range, noisy measurements, or simply leaving the measurement too long after the separation is completed. Some of these points were partially addressed in the Qualitance v3.1, but now a more complete set of functions has been implemented in the R&D software version (Monitor).
Here are some of the functions that, besides the new algorithm, will help you get a better fitting your experimental data:
- Changing the number of points that the algorithm does not consider for the fitting
The firsts/lasts point of the measurements can be affected by the introduction or removal of the bottle. Adding these points to the expected sigmoidal behavior may mislead the algorithm. Removing the Np first and last values will help the convergence.
- Filter the noise using the running average
Very diluted samples and/or translucid bottles may generate a low contrast, hence the experimental values will be ‘noisy’. Using a running average, the curve will be smoothed and it will improve the determination coefficient. By default, Nav =1.
- Modify the final time, tf
Having too much data once the curve nears its minimum value may endanger the fitting algorithm, losing detail on the initial part of it. On the other hand, not having enough data after t50, will produce a loss of adjustment in the final part.
Do you want to TRY? Just go to our Upgrade Software page and download the software. It is FREE for all the customers already using the Monitor v2.x or Qualitance v3.1. The upgraded version can be installed on any computer where the previous version was installed. The oldest version will remain active, so you can use any of them during your internal training/evaluation/qualification period.
If you want to install the software on a new computer or if you only have the oldest versions of Sepmag software, please contact your local representative or send us an e-mail at contact@sepmag.eu.
Regarding Sepmag’s Monitoring software
Sepmag provides two different versions of our software: Monitor (link to video) is intended for R&D purposes and Qualitance (link to video) for productions and Quality Control purposes.
Regarding Optical Monitoring of Biomagnetic Separation Processes
The traditional way of checking whether a Biomagnetic Separation Process is completed is by sight. The technician/researcher looks at the suspension. At the beginning of the process, the suspension is homogenous and opaque. When the separation process is complete, the magnetic beads are left on the walls of the vessel and the supernatant is transparent. When the suspension is ‘transparent’, the technician stops the process by extracting the supernatant, leaving the magnetic beads in the bottle. With the traditional method, the only quality control record is the OK/Not OK signed by the person handling the vessel, without any supporting data
Nevertheless, by continuously monitoring the opacity of the suspension while inside the Sepmag, technicians have a record of its evolution during the process. Changes in opacity inside a Sepmag Biomagnetic Separation System should be the same if the suspension is the same. Changes in the properties of the magnetic beads (diameter, magnetic charge) and concentration and/or viscosity of the buffer lead to different opacity behavior, so any deviations from the expected pattern serve as an early warning system.


